See what
moves your
brand.

Campaign intelligence for brand, music, and creator marketing.

Follow the story across

  • Instagram
  • TikTok
  • X
  • Spotify

Every post.
One bigger picture.

Bring Instagram, TikTok, and X posts into one campaign, then follow views, engagement, and audience response as the story unfolds.

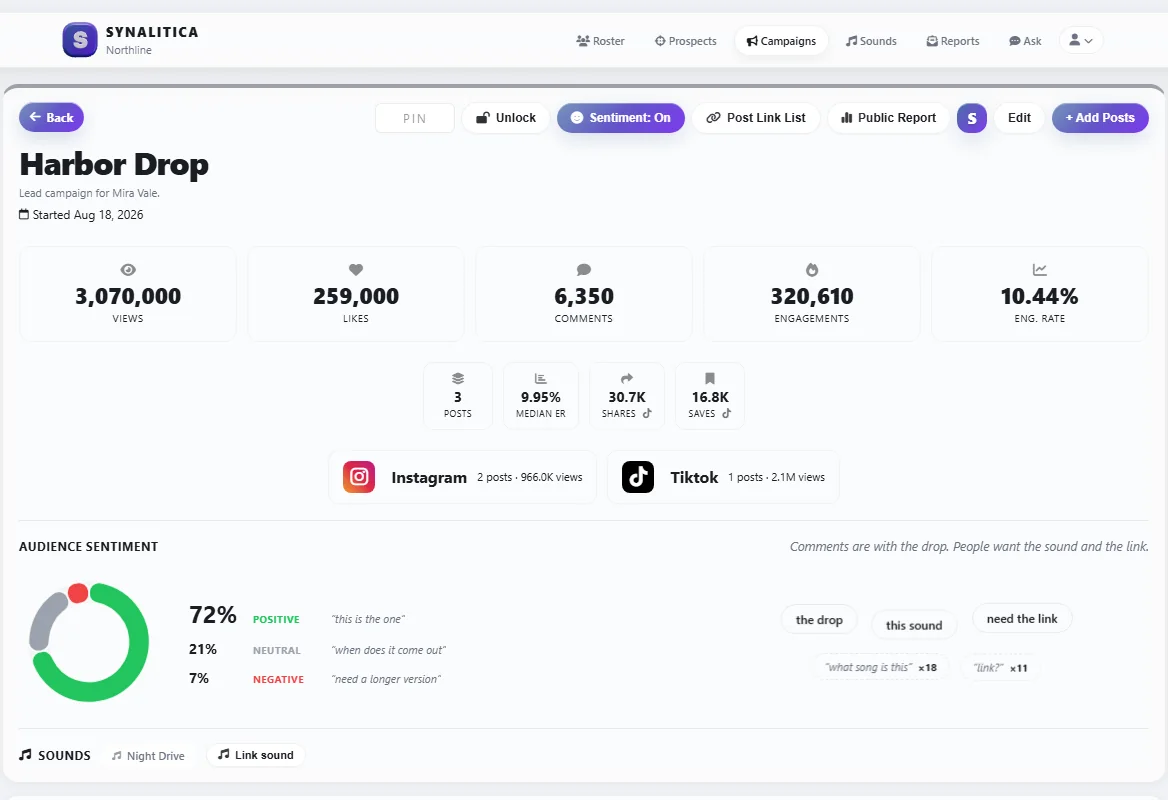
Harbor Drop campaign in Synalitica: 3,070,000 views, 259,000 likes, 6,350 comments, 320,610 engagements, a 10.44% engagement rate, and the Instagram and TikTok split.
Harbor Drop · Example campaign with illustrative data

Every number in one place

Views, likes, comments, engagements, and engagement rate across every post.

Split by platform

See what Instagram, TikTok, and X each added to the total.

Folders that roll up

Group campaigns to see total views, momentum, and the best single day.

Know who’s
moving the story.

Follow the people behind your campaigns: how their audience is growing, which posts stand out, and how performance changes over time.

  • Follower growth and 24-hour change
  • Momentum and hit rate for every creator
  • A typical views range to benchmark new posts
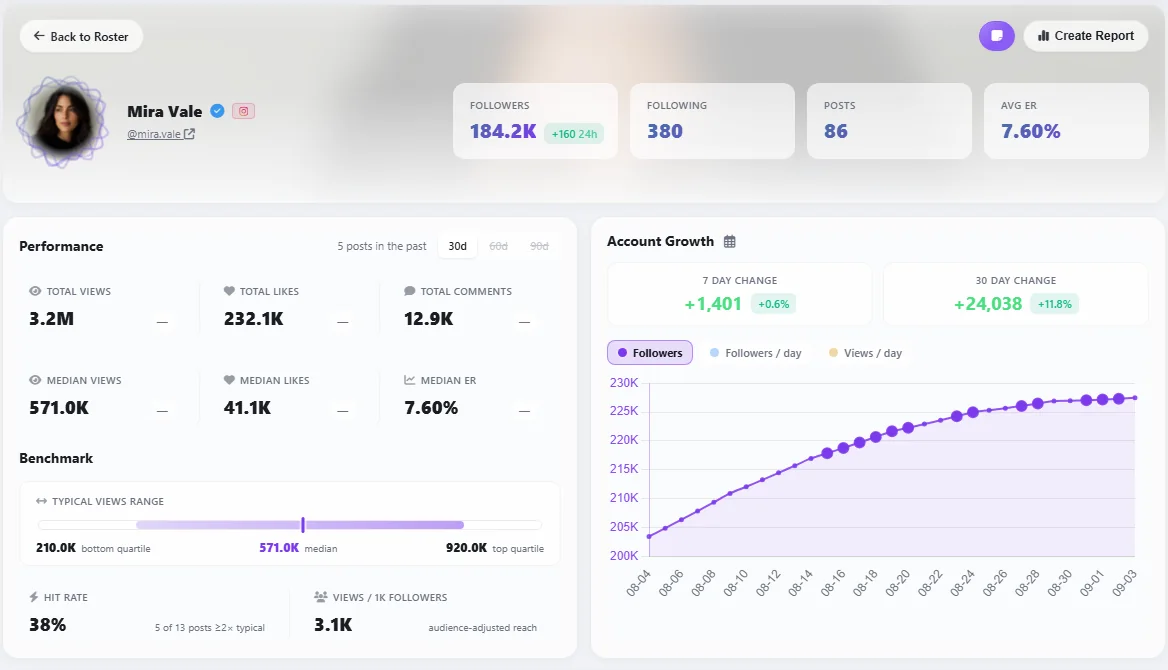
Example creator profile for Mira Vale: 184.2K Instagram followers, performance metrics, a typical views range benchmark, a 38% hit rate, and a rising account growth chart with +1,401 followers in 7 days and +24,038 in 30 days.
Mira Vale · Example creator profile

There’s a story
in the response.

Views tell you how far it traveled. Comments tell you how it landed. See the sentiment and the recurring themes behind your campaign’s engagement.

  • Positive, neutral, and negative share
  • Recurring themes, like “need the link”
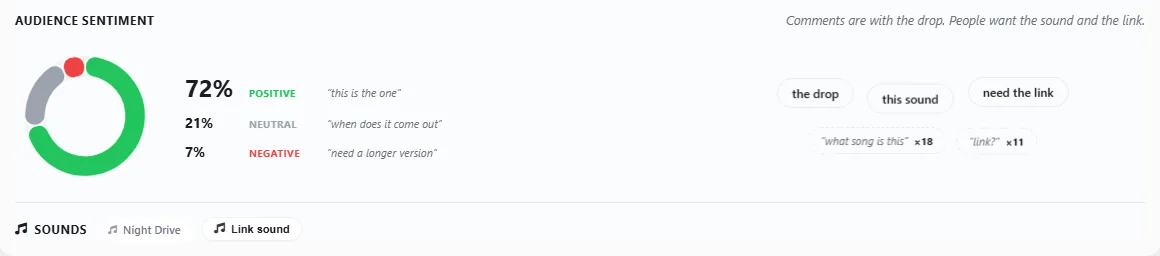
Harbor Drop audience sentiment: 72% positive, 21% neutral, and 7% negative, with example comments for each.
Harbor Drop · Example audience sentiment

From the scroll
to the repeat.

Follow TikTok sound activity and Spotify listener trends alongside your campaign, and see what was happening around the moments attention grew.

  • TikTok sound usage over 24 hours, 7 and 30 days
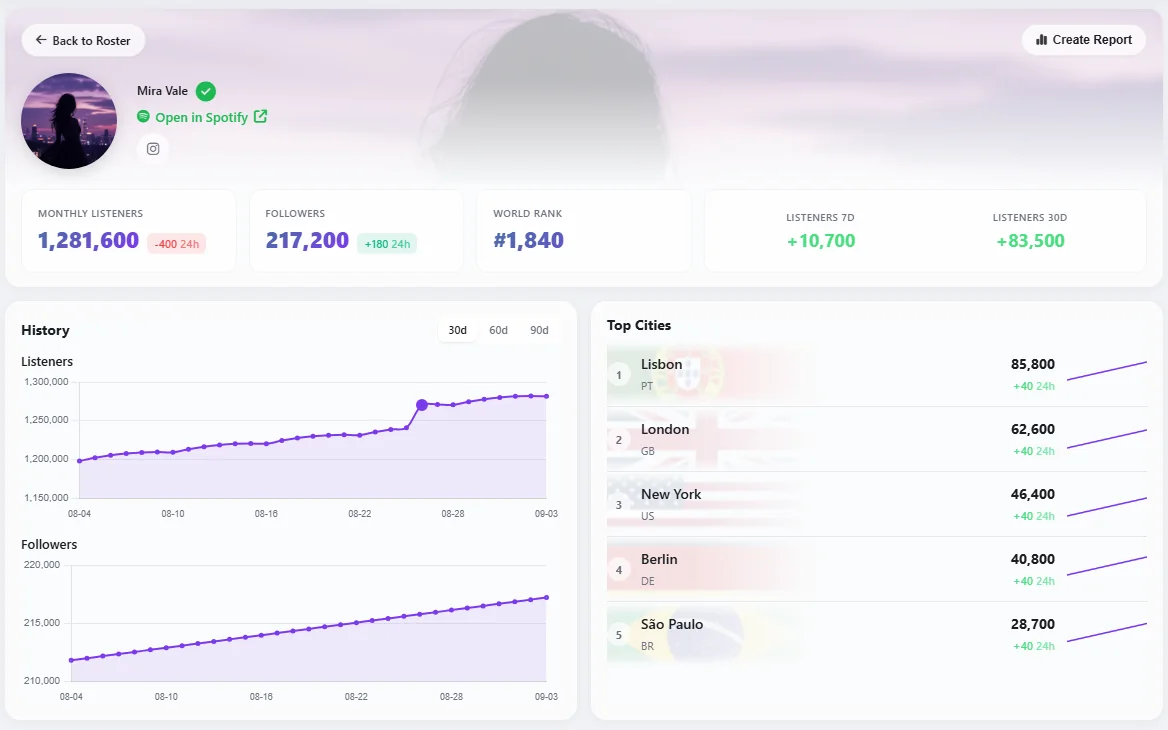
  • Spotify listeners, followers, and top cities
  • Trace: accounts and Spotify on one timeline

Illustrative data. Timing alone doesn’t establish attribution.

Example Spotify artist view for Mira Vale: 1,281,600 monthly listeners, 217,200 followers, world rank #1,840, listener history, and top cities led by Lisbon.
Mira Vale · Example artist and sound data

A good question.
A clearer direction.

Your analytics assistant helps you explore the numbers. Ask about a campaign, a creator, or a change you’ve noticed, and get an answer you can follow.

Your analytics assistantExample

Which posts brought in the most views for Harbor Drop?

Mira’s TikTok led with 2.1M views, about 68% of the campaign total. Her Instagram post added another 842K.

A useful place to start when reviewing which content earned attention.

Let the results
tell the story.

Give clients and your team a clear view of campaign performance: the posts, the progress, and the audience response, together in one shareable report.

  • Public report links for clients
  • Scheduled reports, set up in plain English
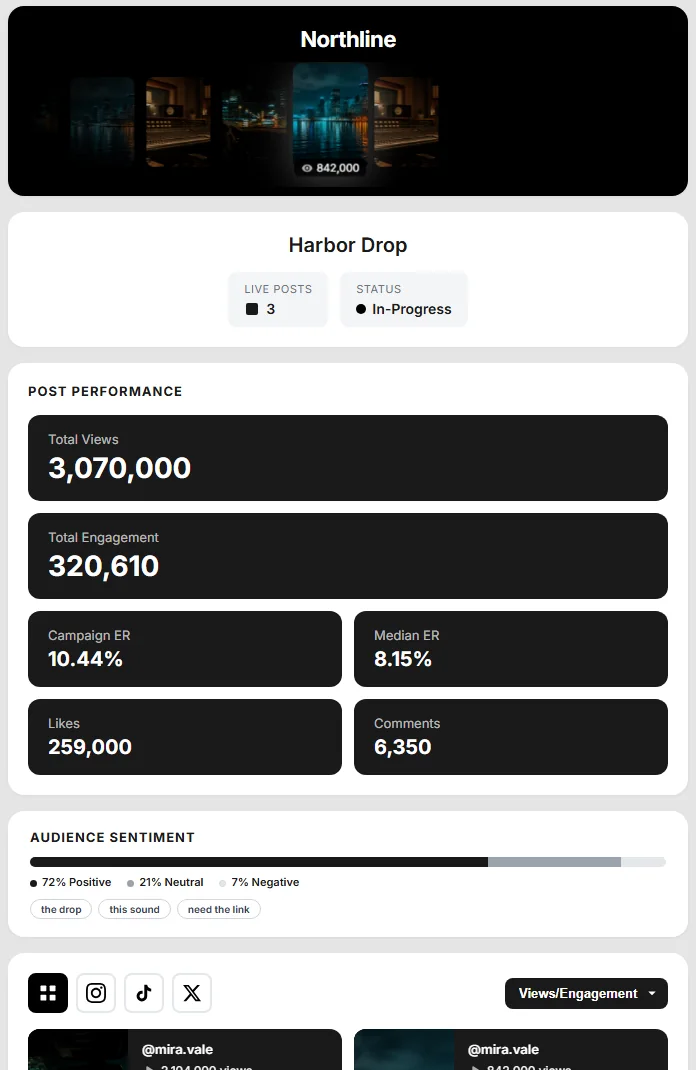
Example public client report for Harbor Drop showing 3,070,000 total views, 320,610 total engagement, a 10.44% campaign engagement rate, likes, and comments.
Harbor Drop · Example client report

Bring your next campaign
into focus.

Choose a time for a 30-minute conversation. Our team will email you to confirm.

Book a demo

Meet your next
clearer perspective.

Choose a time for a 30-minute conversation. Our team will email you to confirm your request.

A request, not a confirmed booking. Your details are used to arrange your demo. Privacy Policy

Request received.

We’ve noted your preferred time. Our team will email you to confirm the date and time.

Back to home